In this tutorial, we will discuss the terms specific to debugging and the steps required to debug PHP programs using Xdebug 3 and Visual Studio Code or VS Code for PHP applications on Ubuntu 20.04 LTS. It assumes that PHP and Web Server are already installed on the Ubuntu system.
You can also follow How To Install PHP 7 On Ubuntu 20.04, How To Install PHP 8 On Ubuntu 20.04 LTS, How To Install Apache 2 On Ubuntu 20.04 LTS, How To Install And Configure Nginx on Ubuntu 20.04 LTS, How To Install PHP For Nginx On Ubuntu 20.04 LTS, and How To Install VSCode For PHP On Ubuntu.
Debugging Terms
This section explains all the major terms specific to debugging. These are listed below.
Current Instruction Pointer - The instruction pointer pointing to the current statement where the debugger is paused and waiting for the next instructions.
Breakpoint - The program execution pauses at the breakpoint until further instructions are not provided by the debugger. The breakpoints are added intentionally to check the program for possible errors.
Step Into - Move to the next statement in case there is no function call or enter the function to debug it in case there is a function call on the current statement. We can step into the function called on the current statement to further check it. The execution will pause at the first statement of the function.
Step Out or Step Return - Execute the remaining statements of the function completely and move out of the function and set the instruction pointer on the statement next to the function call.
Step Over - Execute the current statement without going into the function if it's there. It skips the function and executes it without entering into it.
Resume - Resume the execution as the program executes normally till the next breakpoint encounters. The program execution will pause at the next breakpoint if there is any.
Pause - Pause the current execution. The instruction pointer will point to the statement where the execution pause.
Stop - Terminate the current execution of the program and clear the variables stack and breakpoints from memory.
Install Xdebug
In this section, we will test whether Xdebug for PHP is installed and the steps required to install and configure the most recent version of Xdebug for PHP on Ubuntu 20.04 LTS.
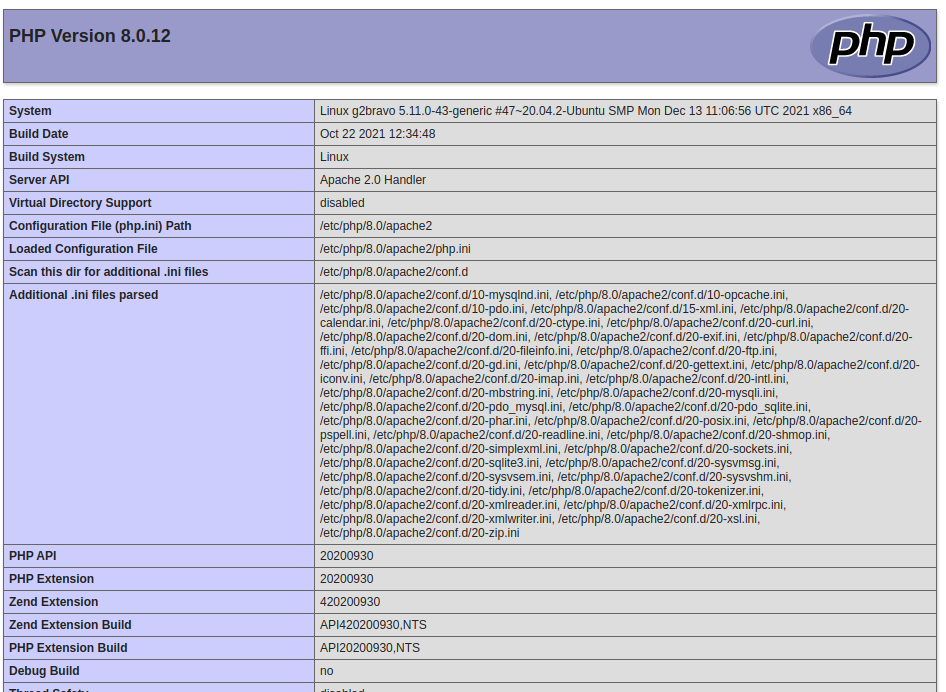
Write a simple program to print the output of phpinfo() function as shown below.
# index.php
<?php
echo phpinfo();
We can either run it on Console or access it via browser. It should be similar to Fig 1.

Fig 1
Now, copy the content and paste it within the input box of Xdebug Installation Wizard as shown in Fig 2.

Fig 2
Now click the Analyse my phpinfo() output button to start analyzing it. It will show whether Xdebug is installed as shown in Fig 3 and also shows the steps to install or update the most recent version of Xdebug for PHP as shown in Fig 4.

Fig 3

Fig 4
We can follow the steps mentioned by the Xdebug analyzer to install Xdebug for PHP 8 on Ubuntu 20.04 LTS as shown in Fig 4.
# Install the pre-requisites to compile PHP extensions
apt-get install php-dev autoconf automake

# Unpack the downloaded file
sudo tar -xvzf xdebug-3.1.2.tgz

# CD
cd xdebug-3.1.2

# Run phpize
sudo phpize

# Output
Configuring for:
PHP Api Version:         20200930
Zend Module Api No:      20200930
Zend Extension Api No:   420200930
config.m4:12: warning: file `build/pkg.m4' included several times
config.m4:12: warning: file `build/pkg.m4' included several times

# Configure
sudo ./configure

# Make
sudo make

# Install
cp modules/xdebug.so /usr/lib/php/20200930

# Configure
sudo nano /etc/php/8.0/apache2/conf.d/99-xdebug.ini

# Configurations
zend_extension=xdebug
[xdebug]
xdebug.mode=develop,debug
xdebug.discover_client_host=1
xdebug.client_port = 9003
xdebug.start_with_request=yes
# Save and exit the editor

# Restart Web Server
Now, verify whether Xdebug is installed by checking the PHP info output as shown in Fig 5.

Fig 5
Install Xdebug extension for VS Code
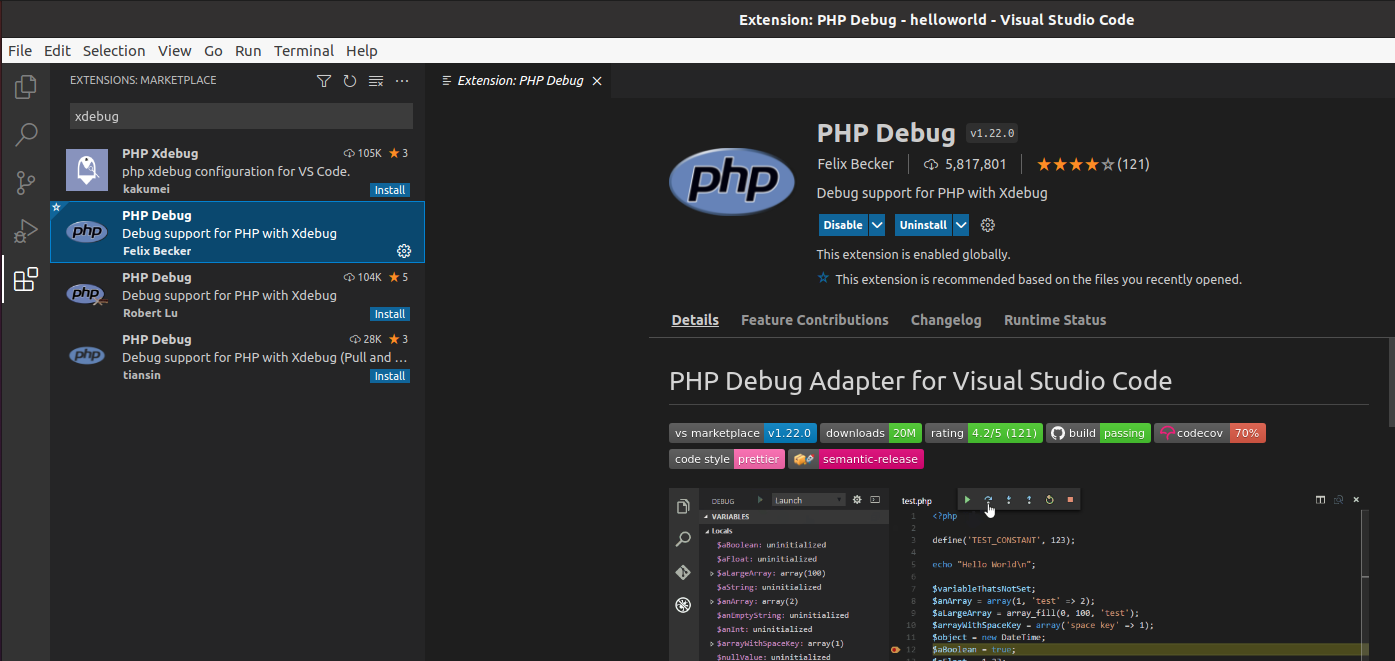
In this step, we will install the Xdebug adapter by Felix Becker for Visual Studio Code. Click the Extensions Icon on the Activity Bar on the left side and search for xdebug. It will list down the available extensions for Visual Studio Code as shown in Fig 6.

Fig 6
In my case, it shows that the PHP Debug is already installed. You can click the Install Button in case it's not installed yet.
Debug PHP using Xdebug and VS Code
In this step, we will open the folder having PHP scripts and add our script for debugging. Now, click the File Option on the top Menu Bar and click the Open Folder Option from the child menu. Also, browse for the folder having the PHP code. It should open the folder as shown in Fig 7.

Fig 7
Now, right-click the source folder and click the New File option. Also, enter the file name as debug.php and hit Enter. It should create the file as shown in Fig 8.

Fig 8
Next, add some code for debugging purposes as shown in Fig 9.
<?php
$numbers = [ 'Zero', 'One', 'Two', 'Three', 'Four', 'Five', 'Six', 'Seven', 'Eight', 'Nine' ];
for( $i = 0; $i < 10; $i++ ) {
    $number = $numbers[ $i ];
    echo $number . "\n";
}
Fig 9
Now, add breakpoints on lines 2 and 6 by clicking on the area at the left of the line numbers as shown in Fig 10.

Fig 10
We also need to configure the Visual Studio Code to debug our code. Click the Run Icon on the Activity Bar on the left side to start configuring for xdebug. It should show the options as shown in Fig 11.

Fig 11
Now, click the create a launch.json file to configure the project for debugging. It will create the file as shown in Fig 12.

Fig 12
It consists of debugging configurations including Listen for XDebug and Launch currently open script. We will update the configuration Listen for XDebug as shown in Fig 13.
I have updated the configuration to map the folder on the Server (left), with the source code folder (right). Also, I have updated the port to 9003 which is the default port for Xdebug 3.

Fig 13
At last, we will start the debugging session to listen to the breakpoints added by us. Also, make sure to keep the web server running before starting the debugging session. Now, click the green-colored Play Icon at the top right side of VS Code. It will start the debugging session and shows the debugging toolbar at the top center area of the editor which contains the debugging controls to debug our code. It will also change the bottom status bar color to orange as shown in Fig 14.

Fig 14
Now try to access the debug.php script from the browser using the URL - http://localhost/debug.php. In the beginning, the debugger will pause at the first breakpoint added by us at line number 2 as shown in Fig 15. Also, Visual Studio Code will maintain the variables and methods call stack as shown in Fig 15.

Fig 15
Now, click the Step Over Icon or press F10 to move to the next step. We can also click the Continue Icon to move to the next breakpoint. Also, keep a note of the variables stack after clicking the Step Over Icon. It should initialize the variable $numbers in the example given by me and as highlighted in Fig 16. Also, check the call stack as highlighted in Fig 16.

Fig 16
Now again press F10 to move the execution to the next statement. It should initialize the $i variable to 0. We can click the Continue Icon or press F5 to move to the next breakpoint which is the same i.e. line number 6 in our case. Also, check the value of the variables $i and $number after clicking the Continue Icon as shown in Fig 17. We can keep on debugging our code till we are done.
We can always click the Stop Icon or press Shift + F5 to stop the execution.

Fig 17
In case of a function call, we can also click the Step Into Icon or press F11 to move the execution to the first statement of the function.
This is all about debugging the source code using VS Code or Visual Studio Code.
Summary
This tutorial provided all the steps to install and configure Xdebug for PHP on Ubuntu 20.04 LTS. It also provided the steps to install the PHP Debug extension for Visual Studio Code and to execute and debug our programs.

