In this tutorial, we will discuss the terms specific to debugging and the steps required to debug PHP programs using Xdebug 3 and NetBeans for PHP applications on Ubuntu 20.04 LTS. It assumes that PHP and Web Server are already installed on the Ubuntu system.
You can also follow How To Install PHP 7 On Ubuntu 20.04, How To Install PHP 8 On Ubuntu 20.04 LTS, How To Install Apache 2 On Ubuntu 20.04 LTS, How To Install And Configure Nginx on Ubuntu 20.04 LTS, How To Install PHP For Nginx On Ubuntu 20.04 LTS, and How To Install NetBeans 12 for PHP on Ubuntu 20.04 LTS.
Debugging Terms
This section explains all the major terms specific to debugging. These are listed below.
Current Instruction Pointer - The instruction pointer pointing to the current statement where the debugger is paused and waiting for the next instructions.
Breakpoint - The program execution pauses at the breakpoint until further instructions are not provided by the debugger. The breakpoints are added intentionally to check the program for possible errors.
Step Into - Move to the next statement in case there is no function call or enter the function to debug it in case there is a function call on the current statement. We can step into the function called on the current statement to further check it. The execution will pause at the first statement of the function.
Step Out or Step Return - Execute the remaining statements of the function completely and move out of the function and set the instruction pointer on the statement next to the function call.
Step Over - Execute the current statement without going into the function if it's there. It skips the function and executes it without entering into it.
Resume - Resume the execution as the program executes normally till the next breakpoint encounters. The program execution will pause at the next breakpoint if there is any.
Pause - Pause the current execution. The instruction pointer will point to the statement where the execution pause.
Stop - Terminate the current execution of the program and clear the variables stack and breakpoints from memory.
Install Xdebug
In this section, we will test whether Xdebug for PHP is installed and the steps required to install and configure the most recent version of Xdebug for PHP on Ubuntu 20.04 LTS.
Write a simple program to print the output of phpinfo() function as shown below.
# index.php
<?php
echo phpinfo();
We can either run it on Console or access it via browser. It should be similar to Fig 1.

Fig 1
Now, copy the content and paste it within the input box of Xdebug Installation Wizard as shown in Fig 2.

Fig 2
Now click the Analyse my phpinfo() output button to start analyzing it. It will show whether Xdebug is installed as shown in Fig 3 and also shows the steps to install or update the most recent version of Xdebug for PHP as shown in Fig 4.

Fig 3

Fig 4
We can follow the steps mentioned by the Xdebug analyzer to install Xdebug for PHP 8 on Ubuntu 20.04 LTS as shown in Fig 4.
# Install the pre-requisites to compile PHP extensions
apt-get install php-dev autoconf automake

# Unpack the downloaded file
sudo tar -xvzf xdebug-3.1.2.tgz

# CD
cd xdebug-3.1.2

# Run phpize
sudo phpize

# Output
Configuring for:
PHP Api Version:         20200930
Zend Module Api No:      20200930
Zend Extension Api No:   420200930
config.m4:12: warning: file `build/pkg.m4' included several times
config.m4:12: warning: file `build/pkg.m4' included several times

# Configure
sudo ./configure

# Make
sudo make

# Install
cp modules/xdebug.so /usr/lib/php/20200930

# Configure
sudo nano /etc/php/8.0/apache2/conf.d/99-xdebug.ini

# Configurations
zend_extension=xdebug
[xdebug]
xdebug.mode=develop,debug
xdebug.discover_client_host=1
xdebug.client_port = 9003
xdebug.start_with_request=yes
xdebug.idekey='NB-IDE'
# Save and exit the editor

# Restart Web Server
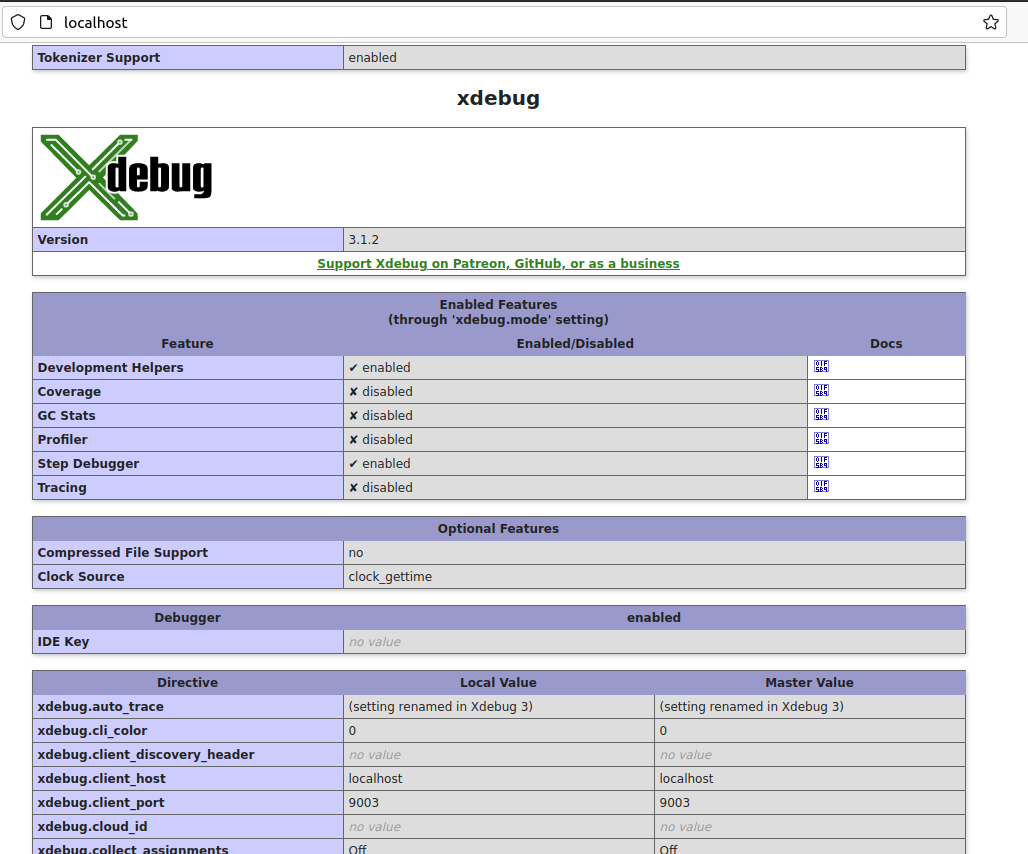
Now, verify whether Xdebug is installed by checking the PHP info output as shown in Fig 5.

Fig 5
Configure NetBeans for Xdebug
In this step, we will configure NetBeans for Xdebug. Now, right-click the Project and click Properties from the available options. We can configure the project webroot as shown in Fig 6.

Fig 6
Also, configure the Run Configuration as shown in Fig 7.

Fig 7
Click the OK Button to apply the changes. We also need to configure NetBeans for Xdebug. Now, click Tools -> Options -> PHP -> Debugging and configure the debugger port and session ID as shown in Fig 8.

Fig 8
Click the Apply Button to apply the changes. Also, click the OK Button to close the dialog.
Debug PHP using Xdebug and NetBeans
In this step, we will create the PHP script for debugging, in case it's not ready yet. We can create the PHP file by right-clicking the source folder and selecting PHP as the file type. I have created the PHP script named debug.php as shown in Fig 9.
<?php
$numbers = [ 'Zero', 'One', 'Two', 'Three', 'Four', 'Five', 'Six', 'Seven', 'Eight', 'Nine' ];
for( $i = 0; $i < 10; $i++ ) {
    $number = $numbers[ $i ];
    echo $number . "\n";
}
Fig 9
Now, add breakpoints on lines 2 and 6 by clicking on the area at the left of the line numbers as shown in Fig 10.

Fig 10
At last, we will start the debugging session to listen to the breakpoints added by us. Also, make sure to keep the web server running before starting the debugging session. Now, right-click the PHP script i.e. debug.php, and click the Debug option as shown in Fig 11.

Fig 11
It will start the debugging session and launch the script using the browser configured for the project. I have configured Firefox as the project browser and the launch should be similar to Fig 12.

Fig 12
Also, the debugger will pause at the first breakpoint added by us at line number 2 as shown in Fig 13. NetBeans will maintain the variables and methods call stack as shown in Fig 13.

Fig 13
Now, click the Step Over Icon or press F8 to move to the next step. We can also click the Continue Icon to move to the next breakpoint. Also, keep a note of the variables stack after clicking the Step Over Icon. It should initialize the variable $numbers in the example given by me and as highlighted in Fig 14 and Fig 15.

Fig 14

Fig 15
Now again press F8 to move the execution to the next statement. It should initialize the $i variable to 0. We can click the Continue Icon or press F5 to move to the next breakpoint which is the same i.e. line number 6 in our case. Also, check the value of the variables $i and $number after clicking the Continue Icon as shown in Fig 16. We can keep on debugging our code till we are done.
We can always click the Stop Icon or press Shift + F5 to stop the execution.

Fig 16
In case of a function call, we can also click the Step Into Icon or press F7 to move the execution to the first statement of the function.
This is all about debugging the source code using NetBeans.
Summary
This tutorial provided all the steps to install and configure Xdebug for PHP. It also provided the steps to configure Xdebug for NetBeans and to execute and debug our programs.

