In this tutorial, we will discuss the terms specific to debugging and the steps required to debug PHP programs in Windows using the Xdebug for PHP and NetBeans IDE. It assumes that PHP is already installed. You can follow How To Install PHP 7 On Windows OR How To Install PHP 8 On Windows to install the most recent version of PHP 7 or PHP 8. You can also follow How To Install NetBeans 12 for PHP on Windows to install the most recent version of NetBeans. The other relevant tutorials include How To Install WampServer on Windows, How To Install XAMPP On Windows 10, and How To Install Apache 2 On Windows.
Debugging Terms
This section explains all the major terms specific to debugging. These are listed below.
Current Instruction Pointer - The instruction pointer pointing to the current statement where the debugger is paused and waiting for the next instructions.
Breakpoint - The program execution pauses at the breakpoint until further instructions are not provided by the debugger. The breakpoints are added intentionally to check the program for possible errors.
Step Into - Move to the next statement in case there is no function call or enter the function to debug it in case there is a function call on the current statement. We can step into the function called on the current statement to further check it. The execution will pause at the first statement of the function.
Step Out or Step Return - Execute the remaining statements of the function completely and move out of the function and set the instruction pointer on the statement next to the function call.
Step Over - Execute the current statement without going into the function if it's there. It skips the function and executes it without entering into it.
Resume - Resume the execution as the program executes normally till the next breakpoint encounters. The program execution will pause at the next breakpoint if there is any.
Pause - Pause the current execution. The instruction pointer will point to the
Stop - Terminate the current execution of the program and clear the variables stack and breakpoints from memory.
Install PHP
Install the most recent version of PHP. You can either install it using WampServer or separately by following How To Install WampServer on Windows, How To Install PHP 7 On Windows, and How To Install PHP 8 On Windows. This tutorial explains debugging the PHP script in CLI mode using the PHP installed separately by following How To Install PHP 7 On Windows or How To Install PHP 8 On Windows.
Notes: Make sure that you have configured your NetBeans to use the same PHP Interpreter by clicking the Tools -> Options -> PHP and checking the PHP Interpreter in the Basic Tab.
Install NetBeans for PHP
Next, install the most recent version of NetBeans for PHP development by following How To Install NetBeans 12 for PHP on Windows.
Hello World
Write the HelloWorld PHP program in NetBeans as explained in How To Install NetBeans 12 for PHP on Windows.
Configure PHP and Xdebug
In cases where PHP is installed separately, you must create your own php.ini by copying the php.ini-development or php.ini-production in the PHP installation directory. You must also configure the extensions directory in the php.ini file as shown below.
# PHP Extensions
extension_dir = "<path to PHP installation>\ext"

# Example
extension_dir = "E:\tools\php\php-8.1.1\ext"
Use the Xdebug link to check whether it's already installed and activated for PHP. Write a simple PHP program having the below-mentioned code to get the details about PHP.
// Prints PHP info on Console
phpinfo();
Now execute and copy the content from the console and paste it on the Xdebug site as shown in Fig 1.

Fig 1
Click on the Analyse my

Fig 2

Fig 3
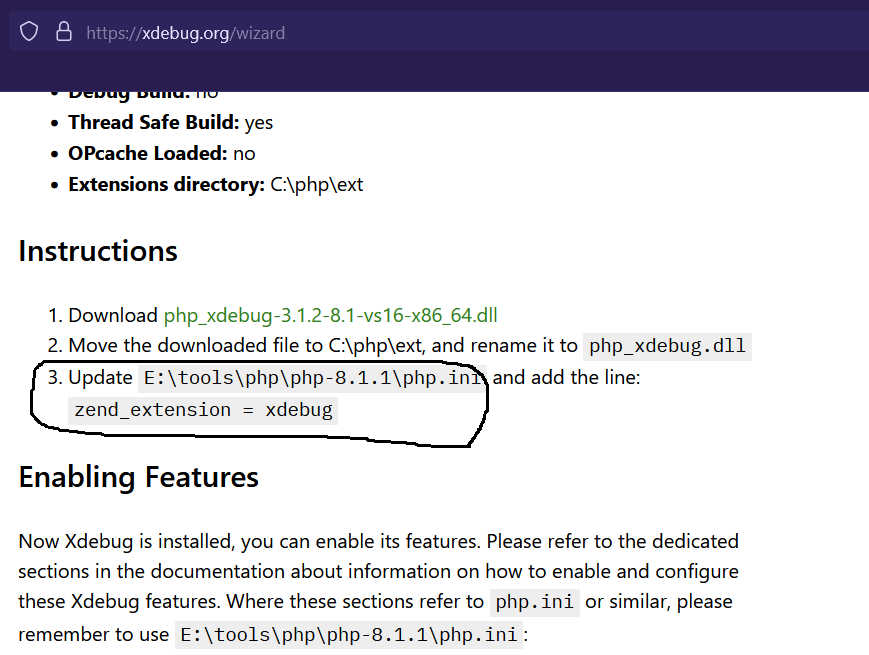
Download and move the downloaded DLL file to the ext directory of PHP installation. Note the php.ini location specified by Xdebug. In my case, it shows the wrong path, though my ext path is E:\tools\php\php-8.1.1\ext as shown in Fig 4.

Fig 4
Make sure that you have added the zend_extension
; XDEBUG Extension
[xdebug]

; Zend Extension
zend_extension = xdebug
In order to debug PHP using NetBeans, you must also enable remote debugging by adding below mentioned configurations to the php.ini file.
; XDEBUG Extension
[xdebug]

; Zend Extension
zend_extension = xdebug

; Configure Xdebug
xdebug.mode = develop,debug
xdebug.idekey = NB-IDE
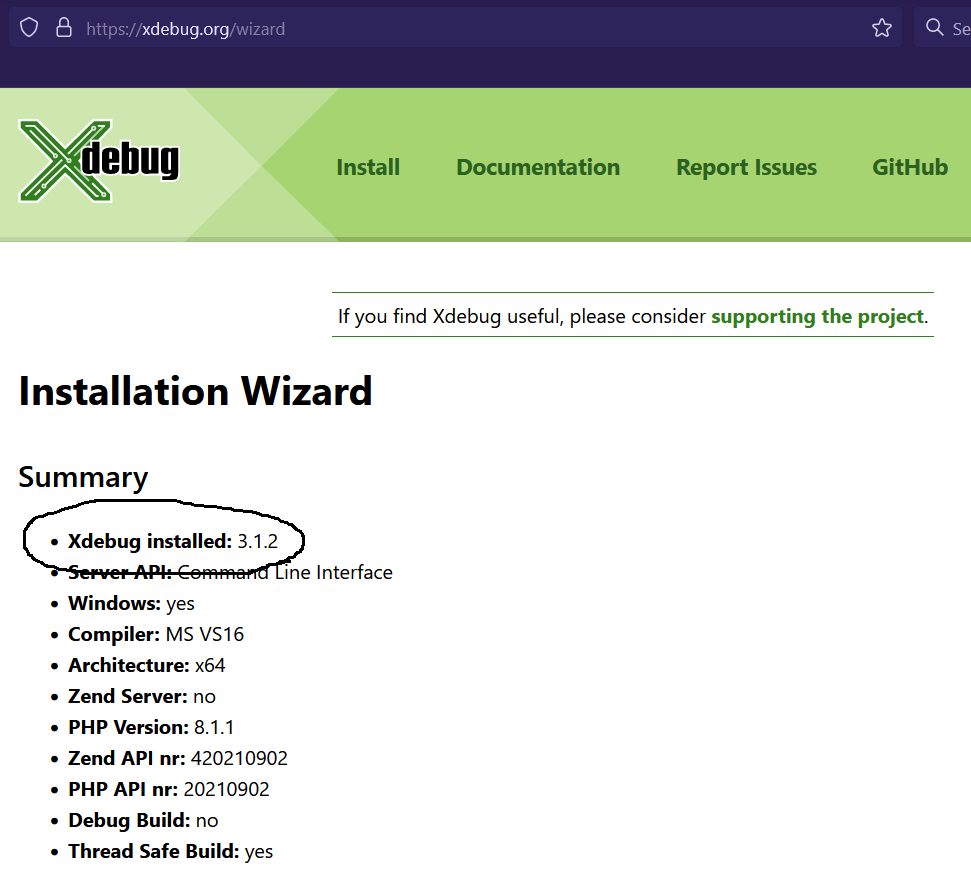
We can again run the PHP program to get the output of phpinfo() and check whether Xdebug is configured for PHP using Xdebug Wizard as shown in Fig 5.

Fig 5
Configure Netbeans
In this step, we will configure NetBeans for Xdebug. Click Tools -> Options -> PHP -> Debugging. It will show the Wizard to configure NetBeans as shown below.

Configure NetBeans
Configure the debugging port and session-id and click Apply Button and close the wizard.
Basic Program to Debug
We will be updating the hello world program written in the previous section by adding a for loop to iterate and print the number spell on the console. The complete program is shown below.
<?php
$numbers = [ 'Zero', 'One', 'Two', 'Three', 'Four', 'Five', 'Six', 'Seven', 'Eight', 'Nine' ];
for( $i = 0; $i < 10; $i++ ) {
    $number = $numbers[ $i ];
    echo $number . "\n";
}

Fig 6
Debug the Program
In this section, we will debug the program by adding breakpoints on lines 2 and 6 as highlighted in Fig 7. We can add a breakpoint by simply clicking the line number.

Fig 7
The red square on the left margin represents the breakpoint added by us. Now right click on the PHP program, and click on Debug Option as shown in Fig 8. You can also use the shortcut keys Ctrl + Shift + F5 to start the debugger.

Fig 8
The debug pointer will pause on the 1st breakpoint as shown in Fig 9.

Fig 9
Click the Step Over Button to execute the first statement. The pointer will move to line 4. We can also see that the variable $numbers is added on the Variables Stack as shown in Fig 10.

Fig 10
Again click on Step Over Button to execute the for statement. It will move the pointer to line 6 and also add the variable $i to the Variable Stack as shown in Fig 11. Similarly, if we again click the Step Over Button, it will add the variable $number to the variables stack showing its value set to Zero.

Fig 11
Now click on the Continue Button and the normal execution starts until the code finds a breakpoint. The pointer will stop on line 6 since we have added a breakpoint on it. We can also click the Run to Cursor Button to pause the debugger at the next Breakpoint. We can also see all the active breakpoints on the Breakpoints Panel as shown in Fig 12.

Fig 12
If we click on the breakpoint on line 6, it will be removed as shown in Fig 13.

Fig 13
Now again click on Continue Button and the program will be fully executed since the pointer won't find any other breakpoint. The complete output will be shown on the console as shown in Fig 14.

Fig 14
This is the easiest way to debug a PHP program using NetBeans on Windows.
Summary
This tutorial provided the reference links to install PHP either using WAMPServer or directly. It also provided the links to download NetBeans for Windows and to write and execute the Hello World program in PHP. The rest of the section provided the steps to debug PHP script using the CLI mode in NetBeans.

