In this tutorial, we will discuss the terms specific to debugging and the steps required to debug PHP programs using Xdebug 3 and NetBeans for PHP applications containerized using Docker containers on Windows 10. It assumes that Docker and NetBeans are already installed on the Windows system.
You can also follow How To Install Docker Desktop On Windows 10, Containerize PHP with Apache, MySQL, and MongoDB using Docker Containers, Containerize PHP with NGINX, MySQL, and MongoDB using Docker Containers, and How To Install NetBeans 12 for PHP on Windows.
Notes:
I am following Containerize PHP with NGINX, MySQL, and MongoDB using Docker Containers for this tutorial.
This tutorial assumes that you have opened your project in NetBeans and also configured it for the appropriate browser to launch the application.
Debugging Terms
This section explains all the major terms specific to debugging. These are listed below.
Current Instruction Pointer - The instruction pointer pointing to the current statement where the debugger is paused and waiting for the next instructions.
Breakpoint - The program execution pauses at the breakpoint until further instructions are not provided by the debugger. The breakpoints are added intentionally to check the program for possible errors.
Step Into - Move to the next statement in case there is no function call or enter the function to debug it in case there is a function call on the current statement. We can step into the function called on the current statement to further check it. The execution will pause at the first statement of the function.
Step Out or Step Return - Execute the remaining statements of the function completely and move out of the function and set the instruction pointer on the statement next to the function call.
Step Over - Execute the current statement without going into the function if it's there. It skips the function and executes it without entering into it.
Resume - Resume the execution as the program executes normally till the next breakpoint encounters. The program execution will pause at the next breakpoint if there is any.
Pause - Pause the current execution. The instruction pointer will point to the statement where the execution pause.
Stop - Terminate the current execution of the program and clear the variables stack and breakpoints from memory.
Install Xdebug
To demonstrate using Xedug for PHP, I will use the same setup done in Containerize PHP with NGINX, MySQL, and MongoDB using Docker Containers. In this step, we will create the Xdebug configuration file and also update the PHP Dockerfile to install and configure Xdebug for PHP.
# docker-compose.yml
....
....

  php:
    container_name: php
    build: ./docker/php
    ports:
      - "9000:9000"
    volumes:
      - ./src:/var/www/html
      - ./xdebug:/var/logs/xdebug
    working_dir: /var/www/html
....
....
# docker/php/xdebug.ini
zend_extension=xdebug

[xdebug]
xdebug.mode=develop,debug
xdebug.client_host=host.docker.internal
xdebug.start_with_request=yes
xdebug.log='/var/logs/xdebug/xdebug.log'
xdebug.idekey='NB-IDE'
# docker/php/Dockerfile
FROM php:8.1-fpm

RUN apt-get update
RUN apt-get install -y autoconf pkg-config libssl-dev

# MySQL
RUN docker-php-ext-install pdo pdo_mysql mysqli

# MongoDB
RUN pecl install mongodb
RUN echo "extension=mongodb.so" >> /usr/local/etc/php/conf.d/mongodb.ini

# Xdebug
RUN pecl install xdebug-3.1.2
ADD xdebug.ini /usr/local/etc/php/conf.d/xdebug.ini
Now, run the build and up commands of Docker Compose.
# Build
docker-compose build

# Output
mysql uses an image, skipping
phpmyadmin uses an image, skipping
mongo uses an image, skipping
mongo-express uses an image, skipping
Building php
....
....
 => [7/9] RUN pecl install xdebug-3.1.2                                                                           27.7s
 => [8/9] RUN docker-php-ext-enable xdebug                                                                         0.9s
 => [9/9] ADD xdebug.ini /usr/local/etc/php/conf.d/xdebug.ini                                                      0.1s
 => exporting to image
....
....
# Up
docker-compose up

# Output
Starting mongo ... done
Starting php        ... done
Starting mysql ... done
Starting pma        ... done
Recreating mexpress ... done
Starting nginx      ... done
Attaching to mysql, mongo, php, pma, nginx, mexpress
....
....
php              | [14-Dec-2021 02:36:42] NOTICE: fpm is running, pid 1
php              | [14-Dec-2021 02:36:42] NOTICE: ready to handle connections
....
....
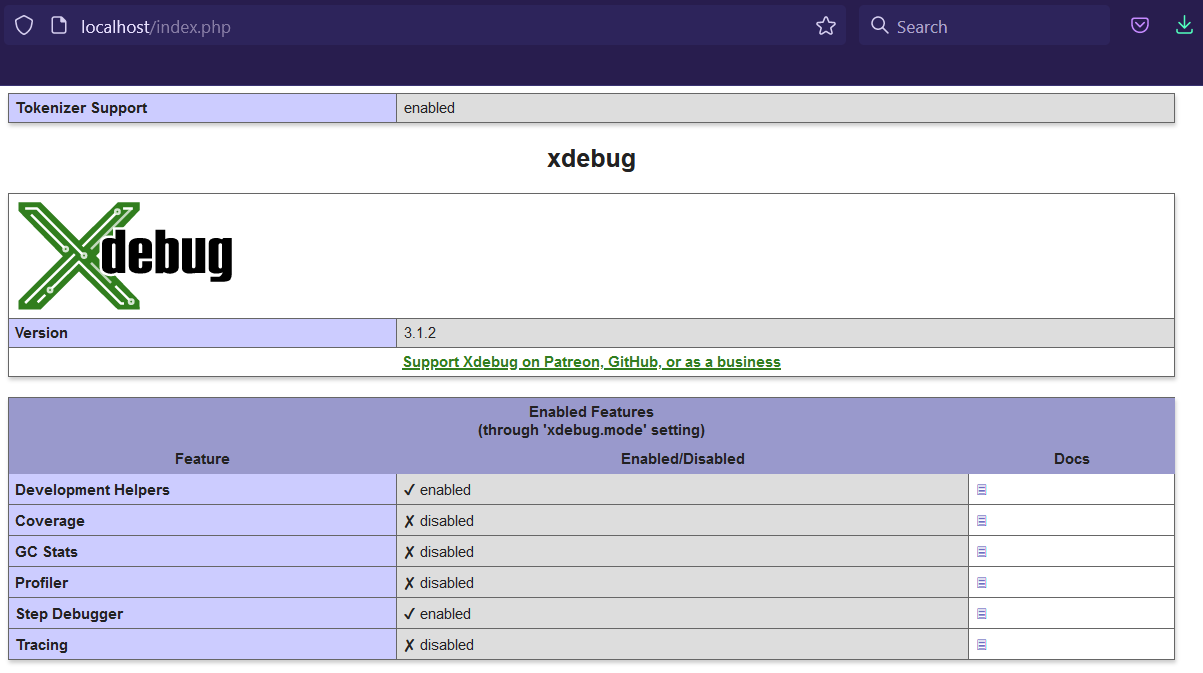
We can verify whether Xdebug is installed by checking the PHP info output as shown in Fig 1.

Fig 1
Configure NetBeans for Xdebug
In this step, we will configure NetBeans for Xdebug. Now, right-click the Project and click Properties from the available options. We can configure the project webroot as shown in Fig 2a.

Fig 2a
Also, configure the Run Configuration as shown in Fig 2b.

Fig 2b
Click the OK Button to apply the changes. We also need to configure NetBeans for Xdebug. Now, click Tools -> Options -> PHP -> Debugging and configure the debugger port and session ID as shown in Fig 3.

Fig 3
Click the Apply Button to apply the changes. Also, click the OK Button to close the dialog.
Debug PHP using Xdebug and NetBeans
In this step, we will create the PHP script for debugging, in case it's not ready yet. We can create the PHP file by right-clicking the source folder and selecting PHP as the file type. I have created the PHP script named debug.php as shown in Fig 4.

Fig 4
Now, add breakpoints on lines 2 and 6 by clicking on the area at the left of the line numbers as shown in Fig 5.

Fig 5
At last, we will start the debugging session to listen to the breakpoints added by us. Also, make sure to keep the Docker Container running before starting the debugging session. Now, right-click the PHP script i.e. debug.php, and click the Debug option as shown in Fig 6.

Fig 6
It will start the debugging session and launch the script using the browser configured for the project. I have configured Firefox as the project browser and the launch should be similar to Fig 7.

Fig 7
Also, the debugger will pause at the first breakpoint added by us at line number 2 as shown in Fig 8. NetBeans will maintain the variables and methods call stack as shown in Fig 8.

Fig 8
Now, click the Step Over Icon or press F8 to move to the next step. We can also click the Continue Icon to move to the next breakpoint. Also, keep a note of the variables stack after clicking the Step Over Icon. It should initialize the variable $numbers in the example given by me and as highlighted in Fig 9.

Fig 9
Now again press F8 to move the execution to the next statement. It should initialize the $i variable to 0. We can click the Continue Icon or press F5 to move to the next breakpoint which is the same i.e. line number 6 in our case. Also, check the value of the variables $i and $number after clicking the Continue Icon as shown in Fig 10. We can keep on debugging our code till we are done.
We can always click the Stop Icon or press Shift + F5 to stop the execution.

Fig 10
In case of a function call, we can also click the Step Into Icon or press F7 to move the execution to the first statement of the function.
This is all about debugging the source code using NetBeans.
Summary
This tutorial provided all the steps to install and configure Xdebug in a Docker container. It also provided the steps to configure Xdebug for NetBeans and to execute and debug our programs.

